


Sleep Score Correlations with Intermittent Fasting, Average Stress Levels, Intensity Minutes — using my personal data, real data

1.Purpose
One of the crucial pillars for a healthy life with an increased lifespan is…SLEEP.
Sleep is impacted by multiple factors and I am curious to find out if there exists a correlation between my sleep score and my intermittent fasting, my average daily stress levels, my daily intensity minutes caused by various sport activities.
Notes:
The relationship between sleep score, intermittent fasting, stress levels and intensity minutes is a complex topic. Research in these areas is ongoing and findings may vary among studies. Here’s a general overview based on existing knowledge up to 2023:
Sleep Score and Intermittent Fasting:
Some studies have suggested a potential link between intermittent fasting and improved sleep, particularly regarding the timing of meals and the body’s circadian rhythms. However, the evidence is not entirely consistent, and individual responses may vary. More research is needed to establish a clear and universal correlation.
Sleep Score and Stress Levels:
There is a well-established bidirectional relationship between stress and sleep. High stress levels can contribute to sleep disturbances, such as difficulty falling asleep or staying asleep. Poor sleep can exacerbate stress. Managing stress through various strategies, including relaxation techniques and stress reduction activities, may positively impact sleep.
Sleep Score and Intensity Minutes:
Regular physical activity, including high-intensity exercise, has been associated with better sleep quality. Engaging in physical activity can help regulate circadian rhythms and promote overall well-being. However, the timing of exercise, individual differences, and other lifestyle factors may influence how physical activity affects sleep.
In the end, I can say that it’s important to note that individual responses to these factors can vary and correlations may be influenced by other lifestyle factors, by health conditions or by individual differences.
2.Requirements
2.1. Business Requirement
Do research by analysing the correlation between my sleep score, my fasting hours, my average daily stress levels, my intensity minutes, based on data collected for the months of January and February 2024.
Identify Correlations:
Check if there are any visible correlations between these 4 metrics.
For example, do days with longer fasting hours correlate with higher sleep scores, or vice versa?
Do days with much more time spent on sports activities correlate with higher sleep scores?
Or, higher stress levels correlate with lower sleep scores?
Read insights using charts and a correlation heat map:
I would like to use a popular data visualisations tool to create charts which can be filtered by month and which I can easily embed in my personal website ( www.andreipostolache.com ) and not only there.
Above the charts I would like to add summary tiles (score cards) for each metric. Also, I want a correlation matrix displayed in a heat map.
2.2. Technical Requirement
I will use the following metrics: Sleep Score (from Garmin), Stress Levels (from Garmin), Intensity Minutes (from Garmin), Fasting Hours (from Google Sheets).
The watch I am using to collect Garmin data is fenix 7 Sapphire Solar.
Explanation of metrics to be used
Sleep Score:
Garmin’s sleep score is a feature designed to provide users with a holistic view of their sleep quality based on various sleep metrics. The sleep score is a numerical value (from 0 to 100) that summarises the overall quality of your sleep for a given night.
Sleep Duration, Sleep Consistency, Deep Sleep, REM Sleep, Sleep Interruptions, Heart Rate Variability are analysed and are part of the way Sleep Score it’s calculated.
Stress Levels:
Garmin devices typically represent stress levels on a scale from 0 to 100, with lower values indicating lower stress and higher values indicating higher stress. The scale may be divided into different zones, such as low, moderate, high, or very high stress. I will use the Average Stress Level value per each day.
Intensity Minutes:
Garmin calculates intensity minutes based on the time spent in different heart rate zones during physical activity. Intensity minutes are a measure of the effort you put into your workouts and are designed to help you track the time you spend at different levels of intensity.
Fasting Hours:
For a while now, each day, I am tracking how many hours are between my last meal (dinner/snack) and my next meal (breakfast/snack).
Final Output
The final output will be a report in Google Looker Studio containing charts with all these metrics and separate comparisons between sleep score and each of those remaining 3 metrics individually. I want correlations results as well, in the same manner. Using Anaconda Notebook, I want to create a correlation matrix for all the 4 metrics.
3. Architecture
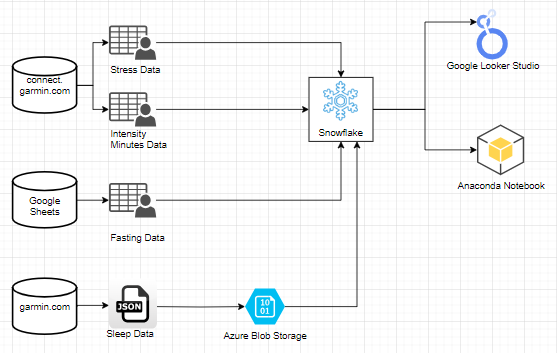
4. Development
4.1. Prepare the environments
Snowflake
Create an account if you haven’t have one and login into
https://app.snowflake.com
Create 1 new database named CORRELATIONS
Create 3 new schemas within CORRELATIONS: STAGING, ODS, DW. I will use STAGING to store the raw data, ODS to store transformed tables, DW to store the final fact
Microsoft Azure (optional, I have used it to load Sleep data, for fun. You can load it directly via Snowflake )
Create an account if you haven’t have one and login into
https://portal.azure.com/
Create 1 new Resource Group or use an existing one
Create 1 new Storage Account or use an existing one
Create 1 new Container or use an existing one
Update the IAM and add a new role assignment (Storage Blob Data Contributor) and assign this role to this Container
DBeaver (optional, same reason as for Microsoft Azure)
Download it from https://dbeaver.io/download/ and create 1 new Database Connection and link it to your Snowflake CORRELATIONS database
Create 1 storage integration with Azure values
Create 1 stage named SLEEPDATA_AZURE
Anaconda.Cloud
Create an account if you haven’t have one and login into
https://anaconda.cloud
Open a new Notebook and prepare to write some Python
Google Looker Studio
Make sure you have access using your Google account to
https://lookerstudio.google.com
4.2. Getting Raw Data
Fasting Hours: I have exported my Google Sheet into a CSV file.

Stress Levels: I have exported the CSVs from https://connect.garmin.com/modern/report . In order to get the daily values for Jan-Feb2024, I had to export multiple CSVs.
Intensity Minutes: same approach as for Stress Levels.

Sleep Scores: because there is no report with Sleep Scores in https://connect.garmin.com/modern/report , I have asked a data export from https://www.garmin.com/ro-RO/account/datamanagement/exportdata/.
Here’s the final list of the input files:

4.2. Load Raw Data into Snowflake
As I said above, I could have loaded the raw data into Snowflake without any use of DBeaver and Microsoft Azure but I wanted to try it that way for Sleep Data.
Beside Sleep data, for the rest of the inputs, the tables will be created upon loading, see the example below for Stress data:

Raw Data will be loaded into schema = STAGING. In the end this is how schema = STAGING is looking.

4.3. Transform Data and populate ODS
Align the same date format across all the inputs
For a proper research, fetch the Sleep Score from the previous day. Garmin stores the Sleep Score for a night into the next calendar day. Example: if I want to analyse the correlations for 10th of February, then I want to use my Stress Levels, my Intensity Minutes, my Fasting Hours from the 10th and also the Sleep Score for the sleep that started on 10th but it’s saved in Garmin on 11th of February.

4.4. Create the final fact
The name for the final fact is FACT_CORRELATIONS_DAILY and the grain is DD_CALENDAR_DATE. It will be created in schema = DW.
4.5. Get Correlations between Sleep Score and Fasting Hours, Stress Levels, Intensity Minutes
The first result set from below contains correlations for the entire dataset (so both months):

The second result set contains correlations per each month:

4.6. Connect Google Looker Studio with Snowflake
This step is pretty straightforward because Google Looker Studio already has a Snowflake connector.
4.7. Create Correlations report with multiple pages in Google Looker Studio
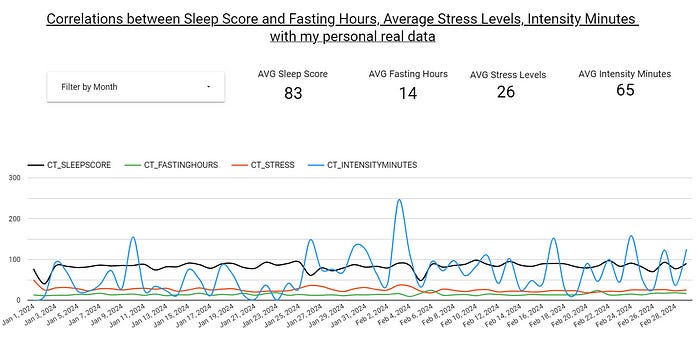
Page1 = Correlations between Sleep Score and Fasting Hours, Average Stress Levels, Intensity Minutes with my personal real data
Page2 = Correlations between Sleep Score and Fasting Hours with my personal real data

Page3 = Correlations between Sleep Score and Average Stress Levels with my personal real data

Page4 = Correlations between Sleep Score and Intensity Minutes with my personal real data

4.8. Create a Seaborn correlation Heatmap in Python
Export the fact into a CSV file from Snowflake and upload it into your Anaconda notebook. Run the Python code available in this article.
Output:

5. Conclusion of my research
First a definition for the correlation coefficient: it’s a measure that quantifies the strength and direction of a linear relationship between two variables. The values range from -1 to 1, where:
1 indicates a perfect positive linear correlation,
-1 indicates a perfect negative linear correlation, and
0 indicates no linear correlation.
As a general guideline:
0 to 0.2: Very weak correlation
0.2 to 0.4: Weak correlation
0.4 to 0.6: Moderate correlation
0.6 to 0.8: Strong correlation
0.8 to 1: Very strong correlation
Ok, now coming back to my results for both months:
Sleep Score vs Fasting Hours = 0.05 , which is close to 0, suggesting a very weak positive linear relationship.
Sleep Score vs Intensity Minutes = 0.29 , which suggests a weak positive correlation.
Sleep Score vs Stress = -0.08 , which suggests a weak negative correlation, indicating a slight tendency for the variables to move in opposite directions.
Overall Summary: 2 Weak, 1 Very Weak
Let’s dive into the results for January:
Sleep Score vs Fasting Hours = 0.35 , indicates a moderate positive linear relationship between two variables. The positive sign suggests that as one variable increases, the other tends to increase as well, and the numerical value of 0.35 indicates a moderate strength of this relationship.
Sleep Score vs Intensity Minutes = 0.05 , which is close to 0, suggesting a very weak positive linear relationship.
Sleep Score vs Stress = -0.13 , which indicates a very weak negative linear relationship between two variables. The negative sign suggests that as one variable increases, the other tends to decrease slightly, but the correlation is weak, meaning the relationship is not strong.
January Summary: 1 Moderate, 2 Very Weak
And for February:
Sleep Score vs Fasting Hours = -0.22 , which indicates a weak negative linear relationship between two variables.
Sleep Score vs Intensity Minutes = 0.47 , which indicates a moderately strong positive linear relationship between two variables. The positive sign suggests that as one variable increases, the other tends to increase as well. The numerical value of 0.47 indicates a moderate strength of this positive relationship.
Sleep Score vs Stress =0.13 , which indicates a very weak positive linear relationship between two variables.
February Summary: 1 Moderate, 1 Weak, 1 Very Weak
Comparing Sleep Score vs Fasting Hours:
In January, it seems that there was a moderate correlation between my Sleep Score and my Fasting Hours, meaning when I had more hours without eating then my sleep score increased. But this correlation in February was a weak one and by looking at both months, the correlation is very weak.
Comparing Sleep Score vs Stress Levels:
In both months the correlation is very weak.
Comparing Sleep Score vs Intensity Minutes:
In January, my total Intensity Minutes were 1638 and in February, 2266 minutes.In terms of the correlation Sleep Score vs Intensity Minutes, the overall correlation is weak. In January there is a very weak positive linear correlation and in February I see a moderately strong positive linear relationship between two variables meaning when I was more active, my sleep was somewhat better.
Final Words:
In the end, I am happy that I got these insights based on my own Health & Fitness data that I am collecting on a daily basis. It’s my first research based on my own Health & Fitness data.
This small research was also a good exercise of my data skill sets using popular tools/platforms like Snowflake, Microsoft Azure, Google Looker Studio, Anaconda Notebooks.
6. Link to my report
https://lookerstudio.google.com/reporting/e53540fd-e339-4a02-a507-06152964a057
7. Full scripts
https://github.com/andreipostolachedotcom/correlations-sleep-fasting-stress-intensity
Thank you for reading this far! Let’s stay connected: https://www.linkedin.com/in/postolacheandrei/